


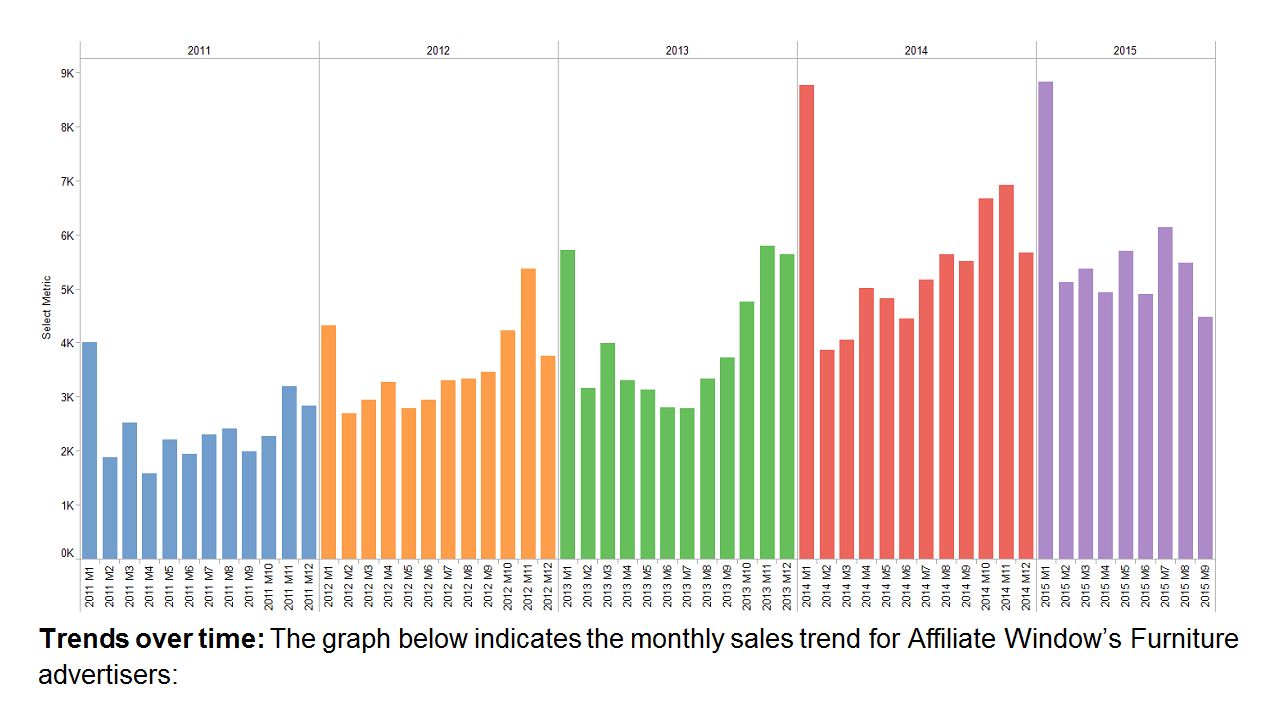
In spite of struggling during the latest recession and being impacted by falling house prices around 2009, the Furniture sector has proved resilient and has seen consistent growth between 2010 and 2015. An IBIS World report indicates that 2015-16 revenue growth in the sector will be around 2.5% equating to £12.6 billion for furniture and home ware, bringing 2015 performance to a similar level prior to the recession.
Over the past few years there have been some significant changes in the industry, shaking up the traditional dominance of offline retail stores. Verdict’s e-retail survey published in March this year showed online pure play e-retailers have gained strong popularity with consumers, even without the presence of physical stores.
There has also been a rise in “show-rooming” (especially among mobile shoppers) of visiting physical stores and then turning to online to purchase their furniture. Made.com a digital pure-play in the sector who has seen significant growth, has responded by opening showrooms in London, Redbrick, West Yorkshire and Liverpool, encouraging customers to test out before they buy online. Given these trends it is imperative that Furniture retailers align their offline & digital strategies, and provide a smooth customer journey for mobile shoppers.
On the other side some furniture retailers with traditional offline presence are working hard to improve online journeys to catch up with consumer trends and to gain a strong advantage against competitors in the sector. Furniture retailers from both perspectives will need cohesion between online and offline journeys in a cross-channel and cross-device industry to outpace the increasing competition.
Affiliate trends
We have seen consistent growth in the affiliate channel, with average annual growth at 19.60% from 2011 to 2015 year to date. 2015 saw sales grow by 7.74% from last year. Customers are also increasing spend, with AOVs improving by nearly £27 from 2011 to 2015, at £416 this year. Annual year to date revenue has increased on average by 21.24% annually.
Mirroring overall sector trends, mobile sales have also increased considerably, with smartphones accounting for 9.16% of sales in 2015 versus 4.81% last year.
Key Performance Indicators
Average Order Value (AOV)
Alongside growth in revenue and sales, AOV’s have increased in the sector, with £416.30 seen this year, and peaking in September 2015 at £452.30. This is up from an AOV of £385.54 seen in 2014.
Conversion rate
Conversion rates have dropped slightly over the past two years in spite of growth in the sector, down to 2.04% in 2015 versus 2.14% in 2013.
EPC and commissions
The EPC has grown in the furniture sector since 2013, with clicks earning on average £2.46 this year, up from £2.03 in 2013. The average commission has dropped to £19.94 in 2015 from £23.02 in 2013, however is still significantly stronger than the average EPCs in retail as a whole.
Mobile performance
We have seen considerable growth in mobile sales over the past two years, with smartphones increasing to 9.16% of total sales in 2015 (up from just 2.93% in 2013). Coupled with this smartphone conversion rates have improved to 1.14% this year, versus 0.82% in 2013. Tablets accounted for 25.91% of sales in 2015, compared with 23.51% in 2013.
Tools for affiliates
Typically most furniture programmes will offer affiliates standard banner creative and text links. Some programmes also offer product feeds, various voucher code and deals.
Affiliate mix
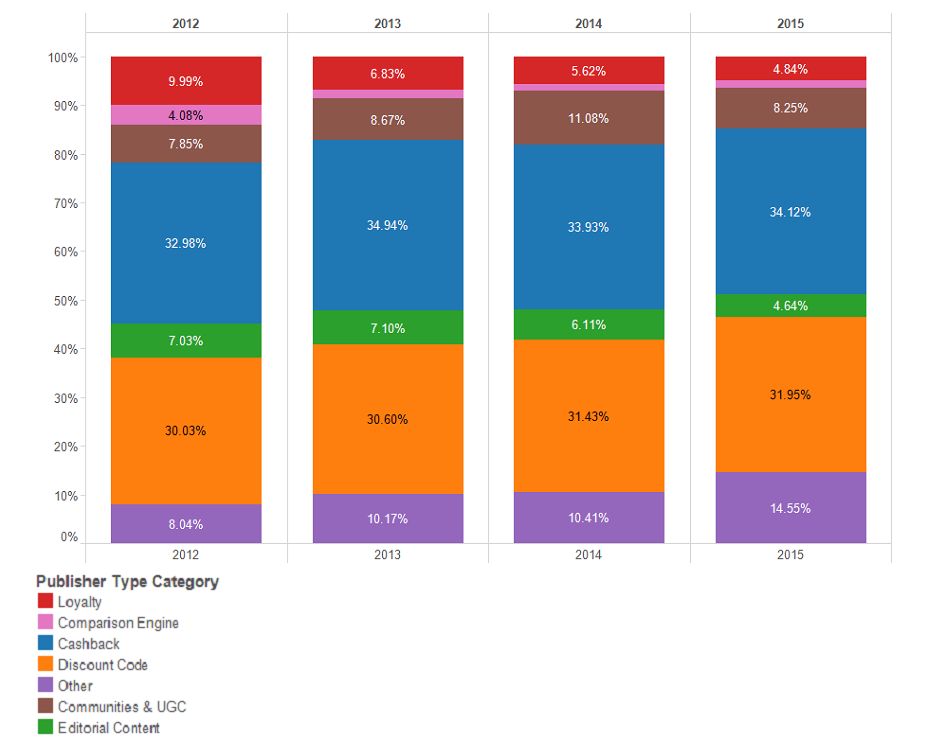
In the chart below, we’ve broken out the percentage of affiliate’s transactions by publisher type. Several publisher categories have held a consistent share since 2012, with cashback accounting for a 34.12% majority of sales in 2015, followed by discount code at 31.95%. We have seen a slow decline in editorial content and loyalty sites which dropped to 4.64% and 4.84% of sales respectively in 2015.
Finally, we’ve put together some niche sites to consider for the sector:
