At Affiliate Window we’ve been focusing on several niche sectors with the advertisers we work with. The aim of these reports has been to shed greater light on the nuances seen within these specific advertisers, who quite often differ from the typical retail, travel and finance affiliate trends, and to provide sector-specific actions for programme managers.
This series looks at variety of sub sectors, taking into consideration online market reports in tandem with typical affiliate reporting metrics such as conversion, AOV, growth/decline curves and device sale splits. This report analyses the giftware and gift cards sector.
Background:
The UK Giftware and Gift Card sector follows typical seasonality trends, seeing peaks around major UK shopping events such as Black Friday, Cyber Monday and the lead up to Christmas online shopping around November and December. Springfair.com indicates the UK giftware sector is worth around £5 billion, with gifts under £10 proving popular. The same report also showed that there has been a revival in gifts made in the UK, as well as retro and unique innovative designs to drive the sector forward.
As with the overall retail sector, Gifting has also benefited from the wider adoption of smartphones and mobile devices for online shopping. EMarketer indicates 33.3% of retail sales are driven from mobile devices and this is expected to rise to 43.7% by 2019, likely shaping the future of the gifting sector too.
Another key trend is the growth of online gift cards, growing by 8.07% in 2014 (UKGCVA). Gift cards also see spikes in sales around the build up to Christmas, with UK consumers spending up to £3 billion in the build up to December 25 last year.
Affiliate trends
We’ve taken a look at the advertiser data within the overall gifting sector, pulling out some of the key trends within. The sector has enjoyed considerable growth over the past few years, with year-to-date revenue growing 30% from 2014. Increasing on average at 15% since 2011, sales have lifted by 31.1% from 2014 to this year.
For the past three years December has outperformed November in total revenue, however the gap is narrowing with 25% of 2014 revenue driven in November last year and 26% in December, with Black Friday continuing to see year-on-year growth.
Trends over time: The graph below indicates the monthly revenue trend for Affiliate Window’s gifting advertisers:

Key Performance Indicators
Average Order Value (AOV)
AOVs have decreased slightly in the gifting sector, with year-to-date average order values (AOV) at £55.37 compared with £58.08 in 2013. With Q4 still largely ahead, we may see the AOV change as we enter the peak trading period.
Conversion rate
The conversion rate has improved in the sector considerably over the past few years. In 2015 we have so far seen this hit 4.65% on average across all devices, compared with 3.37% in 2013 for the same period.
EPC and commissions
Along with conversion rates increasing in the gifting sector, we have also seen the earnings per click (EPC) improve for publishers, growing to £0.21 this year from £0.16 in 2013. Smartphones have been a strong contributor to this growth. Average commission per order is down slightly year to date at £4.47 compared with £4.88 in 2013, however this may change with peak periods still to come.
Mobile performance
Mobile has been a key factor in growth of the gifting sector, with smartphones now accounting for 20.59% of sales in 2015 versus just 8.94% in 2013. Tablet devices now account for 22.16% of sales this year, growing from 15.78% in 2013.
Tools for affiliates
Typically most gifting programmes will offer affiliates standard banner creative and text links. Some programmes also offer product feeds, voucher codes and deals.
Affiliate mix
In the chart below, we’ve broken out the percentage of affiliate transactions by publisher type. Cashback sites have held a consistent share of gifting sales over the past few years, with 32.52% in 2015. Discount code affiliates have grown at a fast rate from 25.18% of sales in 2012 to 30.68% this year. We have seen a gradual decline in loyalty sales to 4.6% this year. However, editorial content still holds 7.44% of sales in 2015 for the sector. Excluding a peak in sales share in 2014, communities and UGC are also rising slowly, growing from 7.37% in 2012 to 7.99% this year.
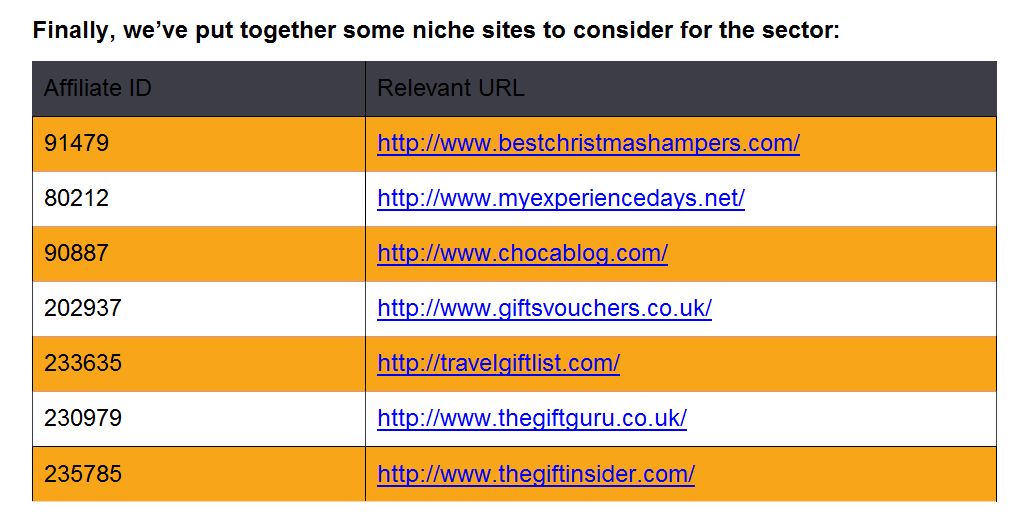
Finally, we’ve put together some niche sites to consider for the sector:


