At Affiliate Window we’ve been focusing on several niche sectors with the advertisers we work with, ranging from DIY & Home Improvements to the UK Holiday Cottages sector, and Foreign Exchange to clothing and Lingerie. The aim of these reports has been to shed greater light on the nuances seen with these specific advertisers, which quite often differ from the typical Retail, Travel and Finance affiliate trends, and to provide sector-specific actions for programme managers.
This series of articles looks at a variety of sub sectors, taking into consideration online market reports in tandem with typical affiliate reporting metrics such as conversion, AOV, growth/decline curves and device sale splits. This report analyses the DIY and Home Improvement sector.
The DIY and Home Improvement sector
The UK DIY and Home Improvement industry has struggled over the past five years, both online and in-store, with declines witnessed among some retailers. A 2015 study by Halifax, showed that a third of adults in the UK give up DIY projects, and an increasing number admit they would ask for third party help.
The sector is closely tied to economic factors, and with UK house prices seeing little growth from 2011 to early 2014, home owners have had fewer incentives to improve their properties. With the upcoming UK May 2015 election, policies around housing may impact the sector further in the second half of the year.
Where is the sector heading?
Fast forwarding to 2015, the sector has now seen numerous points of growth, coming in line with an all-time high in the average housing price reported by Rightmove recently. Looking across our data, covering a strong portion of the industry, we have seen various peaks in the year including the Easter, May and August bank holiday periods. 2014 saw 53% growth against 2013, and so far 2015 has also seen strong growth. Online is also growing much faster than offline, around four times higher according to research by GfK.
The challenge for this year will be for DIY and Home Improvement retailers to maximise opportunities across the remaining holiday periods for 2015, utilising different affiliate types strategically as well as attracting an increasingly time poor customer base around bank holiday weekends.
Looking back at Easter 2015, the bank holiday Monday brought the highest peak of sales accounting for 32% of total sales across the four day weekend, and we can expect similar peaks for sale periods in the rest of the year.
Trends over time
The first graph below indicates the monthly transaction trend for Affiliate Window’s DIY and Home Improvement advertisers.
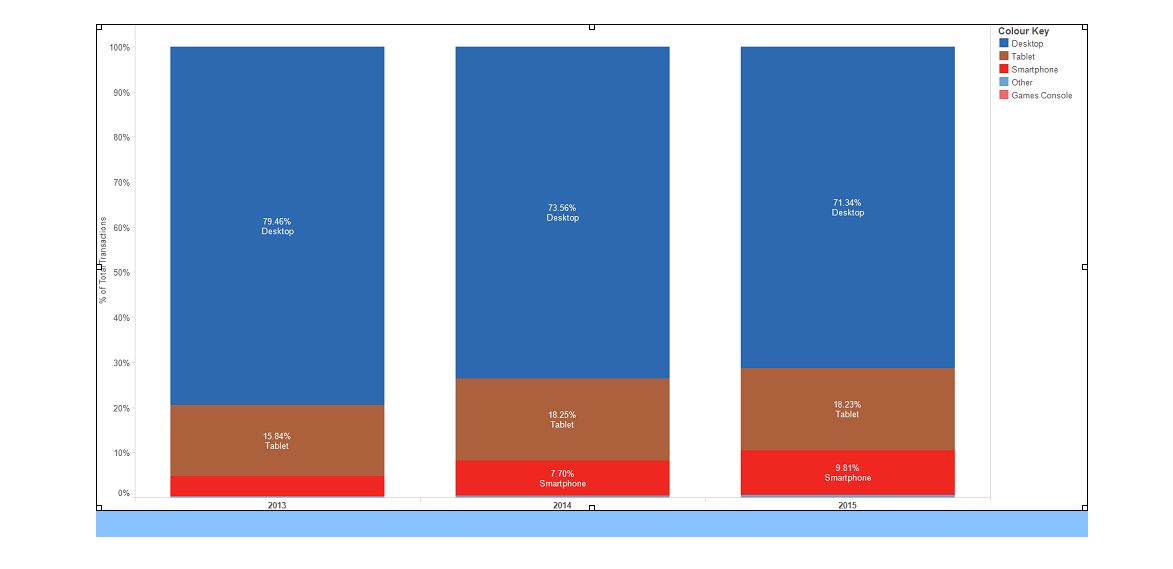
The second chart highlights how tablets and smartphones present growth potential for advertisers, especially those investing in smoother mobile customer journeys to conversion. (Click to enlarge images)

Key Performance Indicators
Average Order Value (AOV)
The Overall AOV for the sector, saw a considerable drop from 2012 at £106.81 to £91.37 in 2014. However moving into 2015 so far the AOV has seen a small amount of growth to £92.39.
Conversion rate
With performance on the increase, conversion rates have also picked up with the average rising to 5.2% in 2014 from 3.94% the previous year. Currently we are seeing 5.92% for 2015.
EPC and commissions
The average EPC for the sector is quite low against the network average of £0.25 for 2014. In spite of this we have saw the sector EPC grow to £0.15 in 2014 versus £0.13, and also further to £0.16 this year. This has been achieved even though CPAs dropped by around 0.5% from 2013 to 2015.
Mobile performance
Tablets have had a continual presence in the share of DIY & Home improvement sales, growing from a 15.84% share in 2013 to 18.23% in 2015, converting at 4.94% in 2015. Smartphones have increased considerably more, growing from a 4.41% transaction share in 2013 to 9.81% this year. Smartphones are currently converting at 3.03% for 2015.
Tools for affiliates
Typically most DIY programmes will offer affiliates a feed, standard banner creative and standard text links.
Affiliate mix
 In the right hand chart, we’ve broken out the percentage of affiliates transactions by publisher type. Cashback and discount codes maintain an increasing share of total sales, likely benefiting from sale periods. Editorial content sites have struggled to hold a 15.99% market share seen in 2012, dropping to 3.77% this year.
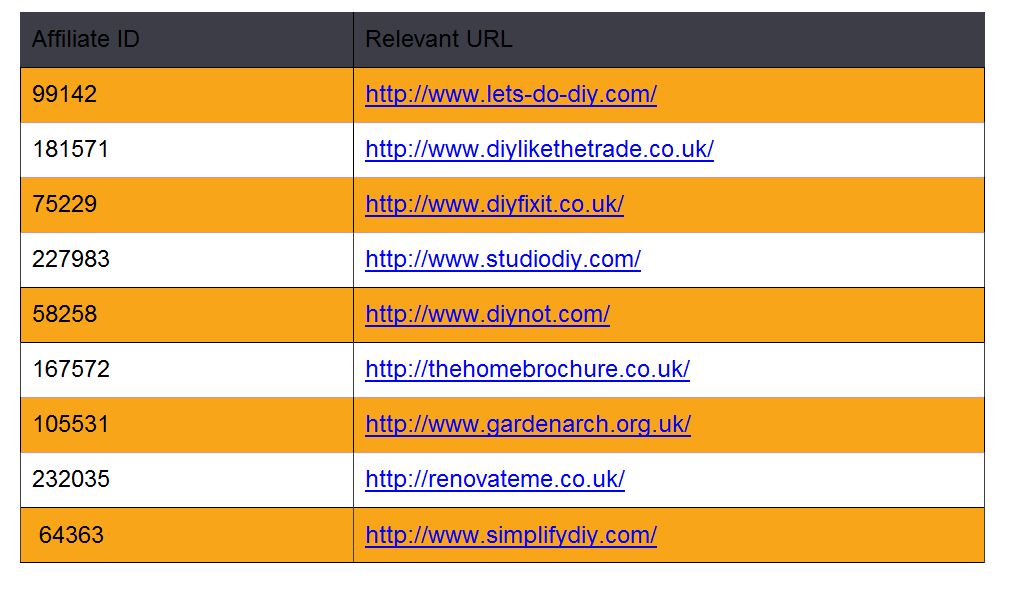
Finally, we’ve put together some niche sites to consider for the sector: