


At Affiliate Window we’ve been focusing on several niche sectors with the advertisers we work with, ranging from DIY & Home Improvements to the UK Holiday Cottages sector, and Foreign Exchange to clothing and Lingerie. The aim of these reports has been to shed greater light on the nuances seen with these specific advertisers, which quite often differ from the typical Retail, Travel and Finance affiliate trends, and to provide sector-specific actions for programme managers.
The following series of articles will look at a variety of sub sectors, taking into consideration online market reports in tandem with typical affiliate reporting metrics such as conversion, AOV, growth/decline curves and device sale splits. The first report analyses the Lingerie sector, where a strong volume of sales are helping to combat fairly low order values
The lingerie sector
The UK online lingerie sector has enjoyed considerable growth over the past few years, with the industry seeing growth of 265%, compared to 116% for the online retail sector between 2009 and 2014. Where typical retailers suffered in sales from post-recessionary customers, the lingerie sector came out unscathed, with analysts now predicting further growth of 18.18% between 2014 and 2019.
Growth in this sector has been aided by several factors including typically low average order values at £36 compared to £58 in clothing generally and a rapid adoption of mobile payment options and browsing functionality. Many advertisers in the sector also offer free delivery over a certain amount, as well as free returns and click-and-collect options. Part of the sector’s success can be attributed to lingerie boutiques catering to a wider range of customer size requirements than traditional department stores, as well as an overall de-commodification of the sector, through the influence of celebrities and large brands such as Victoria’s Secret reinventing the customer experience of lingerie shopping.
With high levels of competition in the sector, advertisers will need to continuously inject creativity into their online propositions to stay ahead of the curve and optimise social and on-site touchpoints. Taking a look at our portion of the affiliate sector, we’ve seen excellent growth, particularly with advertisers offering multi-brand and tailored options. Overall growth stands at 89% for 2015 year to date, versus 2014, with mobile traffic (tablet & smartphone) representing up to 40% of total traffic against 26% last year. So far in 2015, mobile sales have accounted for 32% of all transactions.
 Key Performance Indicators
Average Order Value (AOV)
AOV has remained relatively stable in the sector since 2013, with 2015 up to £49.67 from £44.24 last year, placing the affiliate channel higher than the overall online average.
Conversion rate
The average conversion rate in the Lingerie sector grew from 5.26% in 2013 to 7.23% in 2014, with this year’s average currently at 6.49%. Looking at last year’s trend, we can expect this to rise towards the Christmas peak.
EPC and commissions
Coupled with market growth, the sector is an increasingly lucrative one for affiliates with the average EPC [earnings per click] growing from £0.12 in 2013 to £0.19 so far this year. The average commission is now at £2.93, compared to £2.36 in 2013.
Mobile performance
Tablet devices have maintained a continual presence in the sector, with 22.43% of total transactions in 2015, up from 20.25% in 2013. This has been achieved at a conversion rate of 9%.
Smartphones have grown faster with 9.6% of transactions in 2015 up from 3.39% (2013) and 7.15% (2014). Conversion rates for smartphones are currently at 2.64% for this year.
Tools for affiliates
Typically most Lingerie programmes will offer affiliates a feed, standard banner creative, voucher codes, and text links.
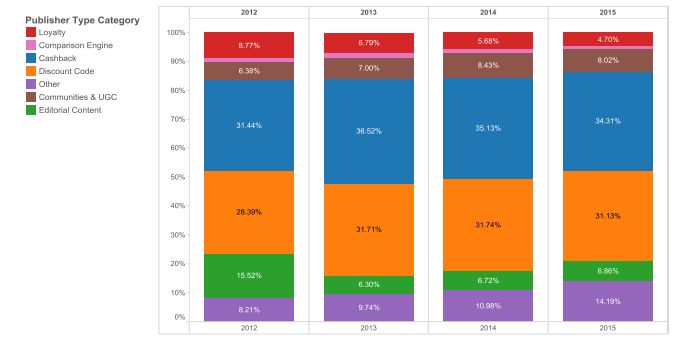
Affiliate mix
In the chart below, we’ve broken out the percentage of affiliate transactions by publisher type. Cashback and voucher code sites have maintained a consistent presence, whilst loyalty affiliates have dropped to 4.7% in 2015. On the other side, communities and UGC [user-generated content] have grown to 8.02% this year from 6.38% in 2012. Editorial content sites have averaged a 6.63% share over the past three years
Finally, we’ve put together some niche sites to consider:
